Ever felt your twitter newsfeed has too much going on that you don’t have time to read them all, let alone digest? I certainly do, even though I only follow like 20 people. Whenever I open the app, I was “bombarded” by all the new tweets and, even after scrolling through all of them (as I feel obligated to), I don’t feel I have actually taken any new information in. How nice would it be if someone handpicked and highlighted all the useful information for us? Well, I made a quick R Shiny app today that does just that. Well, sort of.
It all comes back to the problem how one determines which tweet is important and which is not. In my simple app, I relied on the two low-hanging fruit: the retweet count and the favorite count. Without any deeper knowledge, I’ve always felt the two are very similar to each other. If one bothers to tap his/her finger on one of them, he/she might as well tap the other except, maybe, he/she doesn’t want to have the tweet show on his/her own timeline. Regardless, to keep it simple, I just added the two together, which is probably a very naive way of measuring importance.
But that’s not all of it. Say you follow a popular news source like NYT that has hundreds of retweets for anything it says and a friend of yours who only has a moderate amount of retweets or likes, by simply using the raw retweet/favorite count, it is likely that you will never see your friend’s tweet as it is drowned by NYT’s. To take a user’s own popularity into account, I divided the raw count by its average count of all the tweets collected.* As a result, since NYT has always been able to draw a lot of attention and generate a ton of retweets and favorites, the retweet/favorite count for its current tweet is “discounted” by this fact to be comparable to other less popular accounts, to which, scoring a couple retweets or favorites might be a big deal.
Here is my finished app, which, when opened, pulls the most recent 400 tweets** from my timeline,*** calculates such a metric for all of them, and filters to only show the top 100. This is what it looks like:
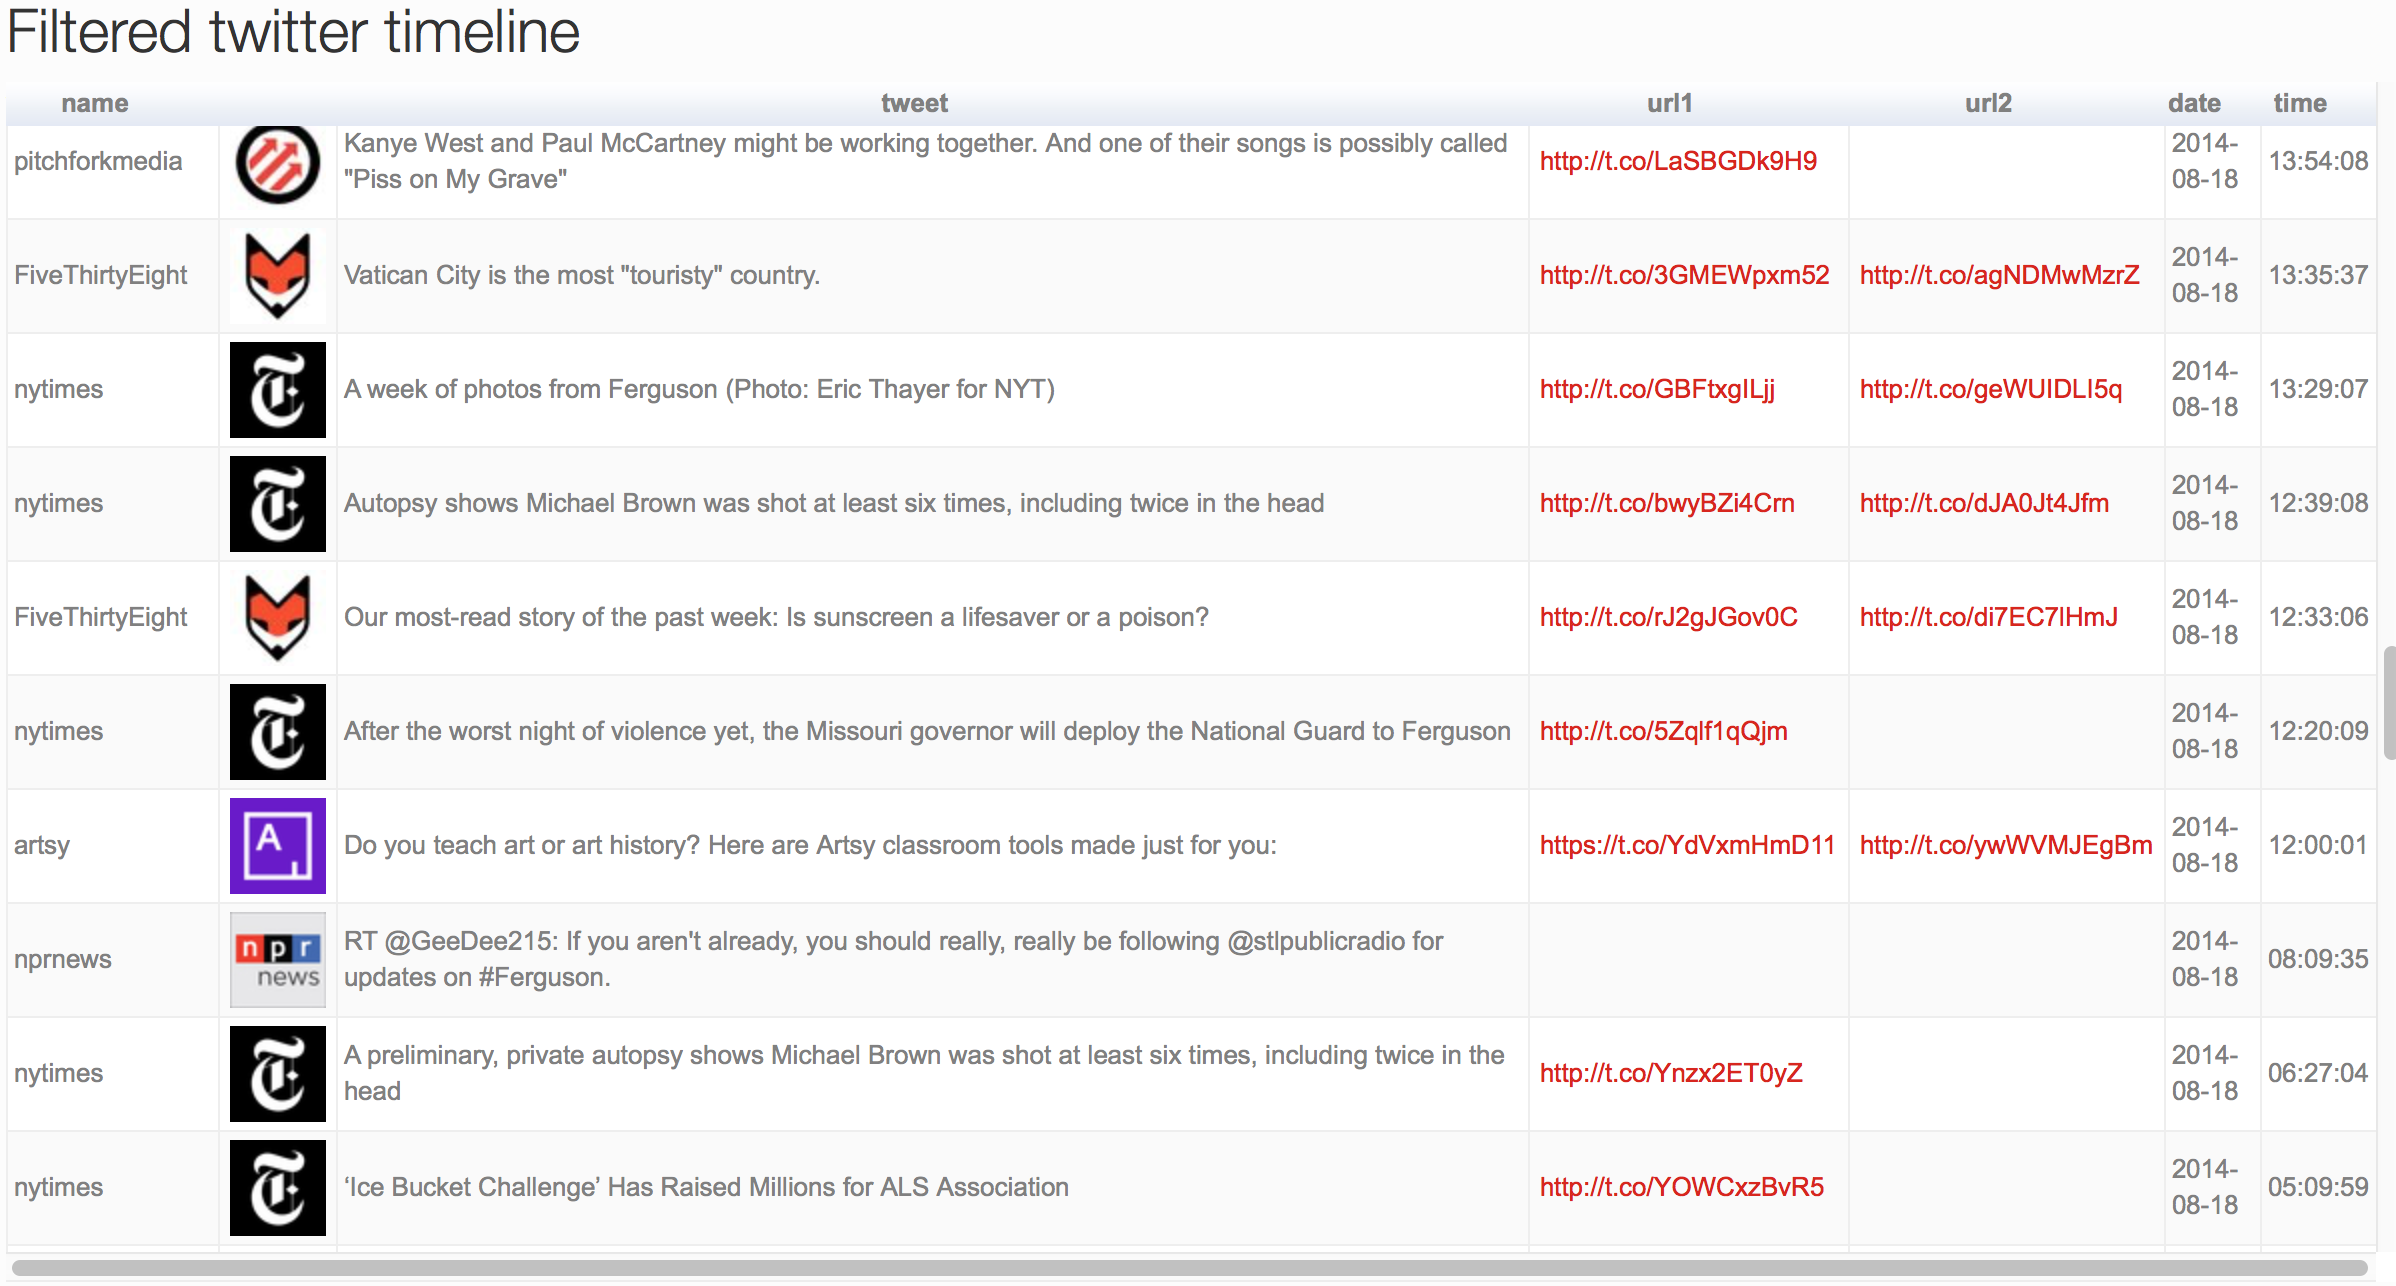
Hopefully I’ll now have enough patience to read all 100 of them :-)
Note:
* Without much historical data, the average is calculated using only the tweets collected in the current session.
** According to the TwitteR package, the theoretical limit of a get request is 3,200 tweets. However, I was never able to hit that limit (usually it just stops far fewer than that). Besides, to take the request time into account, it is probably not worth getting that many (after all, the point of this exercise is to limit the information input). Therefore, I capped each pull at 400. Also beware the rate limit, which is 15 requests per each 15 minute.
*** I have yet to find a way to implement a “sign in with twitter” button like this in Shiny that allows users to log in and retrieves their own filtered timeline. Hence, I can only play around with my own for now, which limits the use of this app. If you know a way of doing that, please let me know!
Finally, the code for this project has been uploaded to github. If you are interested, you can deploy it using your own OAuth object to see your own filtered timeline. I hope it’s useful.