This weekend, I participated in a Kaggle not-for-prize competition that uses data obtained from Reddit’s Random Acts of Pizza forum to analyze and predict the outcome of a request for pizza, and it was heaps of fun (I always wanted to say that)! Compared with other Kaggle competitions I had tried before, I found this one a bit easier because the dataset is not very large (~5,000 records) and is hence perfect for model experimenting, and, more importantly, the competition is based on a real research done by a couple Stanford researchers, which provides me with a lot of guidelines in how to proceed. As my first shot, following the paper, I replicated their study by constructing the same set of variables, and used them to train a few predictive models. The result, .69 ROC, landed me at No. 13 (out of 110)! I have put all my code on github (including the part related to topic modeling and data exploration) and here is a detailed explanation of what I did.
Topic modeling
Following the authors’ strategy, the first thing I did was mining the requests (as it turned out, there are a fair amount of posts with blank content. Hence, I concatenated the request content with the request title). After cleaning them up, removing stop words and keeping only nouns (using the openNLP package), I created a document-term matrix (DTM) using them and removed the very high- and low-frequency words (as they don’t help separate topics) using the term frequency–inverse document frequency (tf-idf) metric (per the method and code described in this vignette). Using this trimmed DTM, I applied the Latent Dirichlet allocation (LDA) algorithm from the topicmodels package (again per the vignette linked above) to identify topics. Note in the paper, the authors used “non-negative matrix factorization (NMF)” to perform topic modeling. However, I wasn’t able to find a package in R to do that. That aside, the 10 buckets of topics I got are not as clearly defined and distinguished as those found by the authors. In fact, I couldn’t see any clear-cut difference in the frequent terms used in my topics at all. Curious, I tried to find the optimal number of topics through a 10-fold cross-validation and evaluated the resulting split using perplexity, which, as defined in the vignette, uses the log likelihood and shares an inverse relationship with it (hence, the lower the perplexity the better the model fits). Funnily, the results, as shown below, suggest 10 is indeed the optimal split (in the range of 2 to 10):
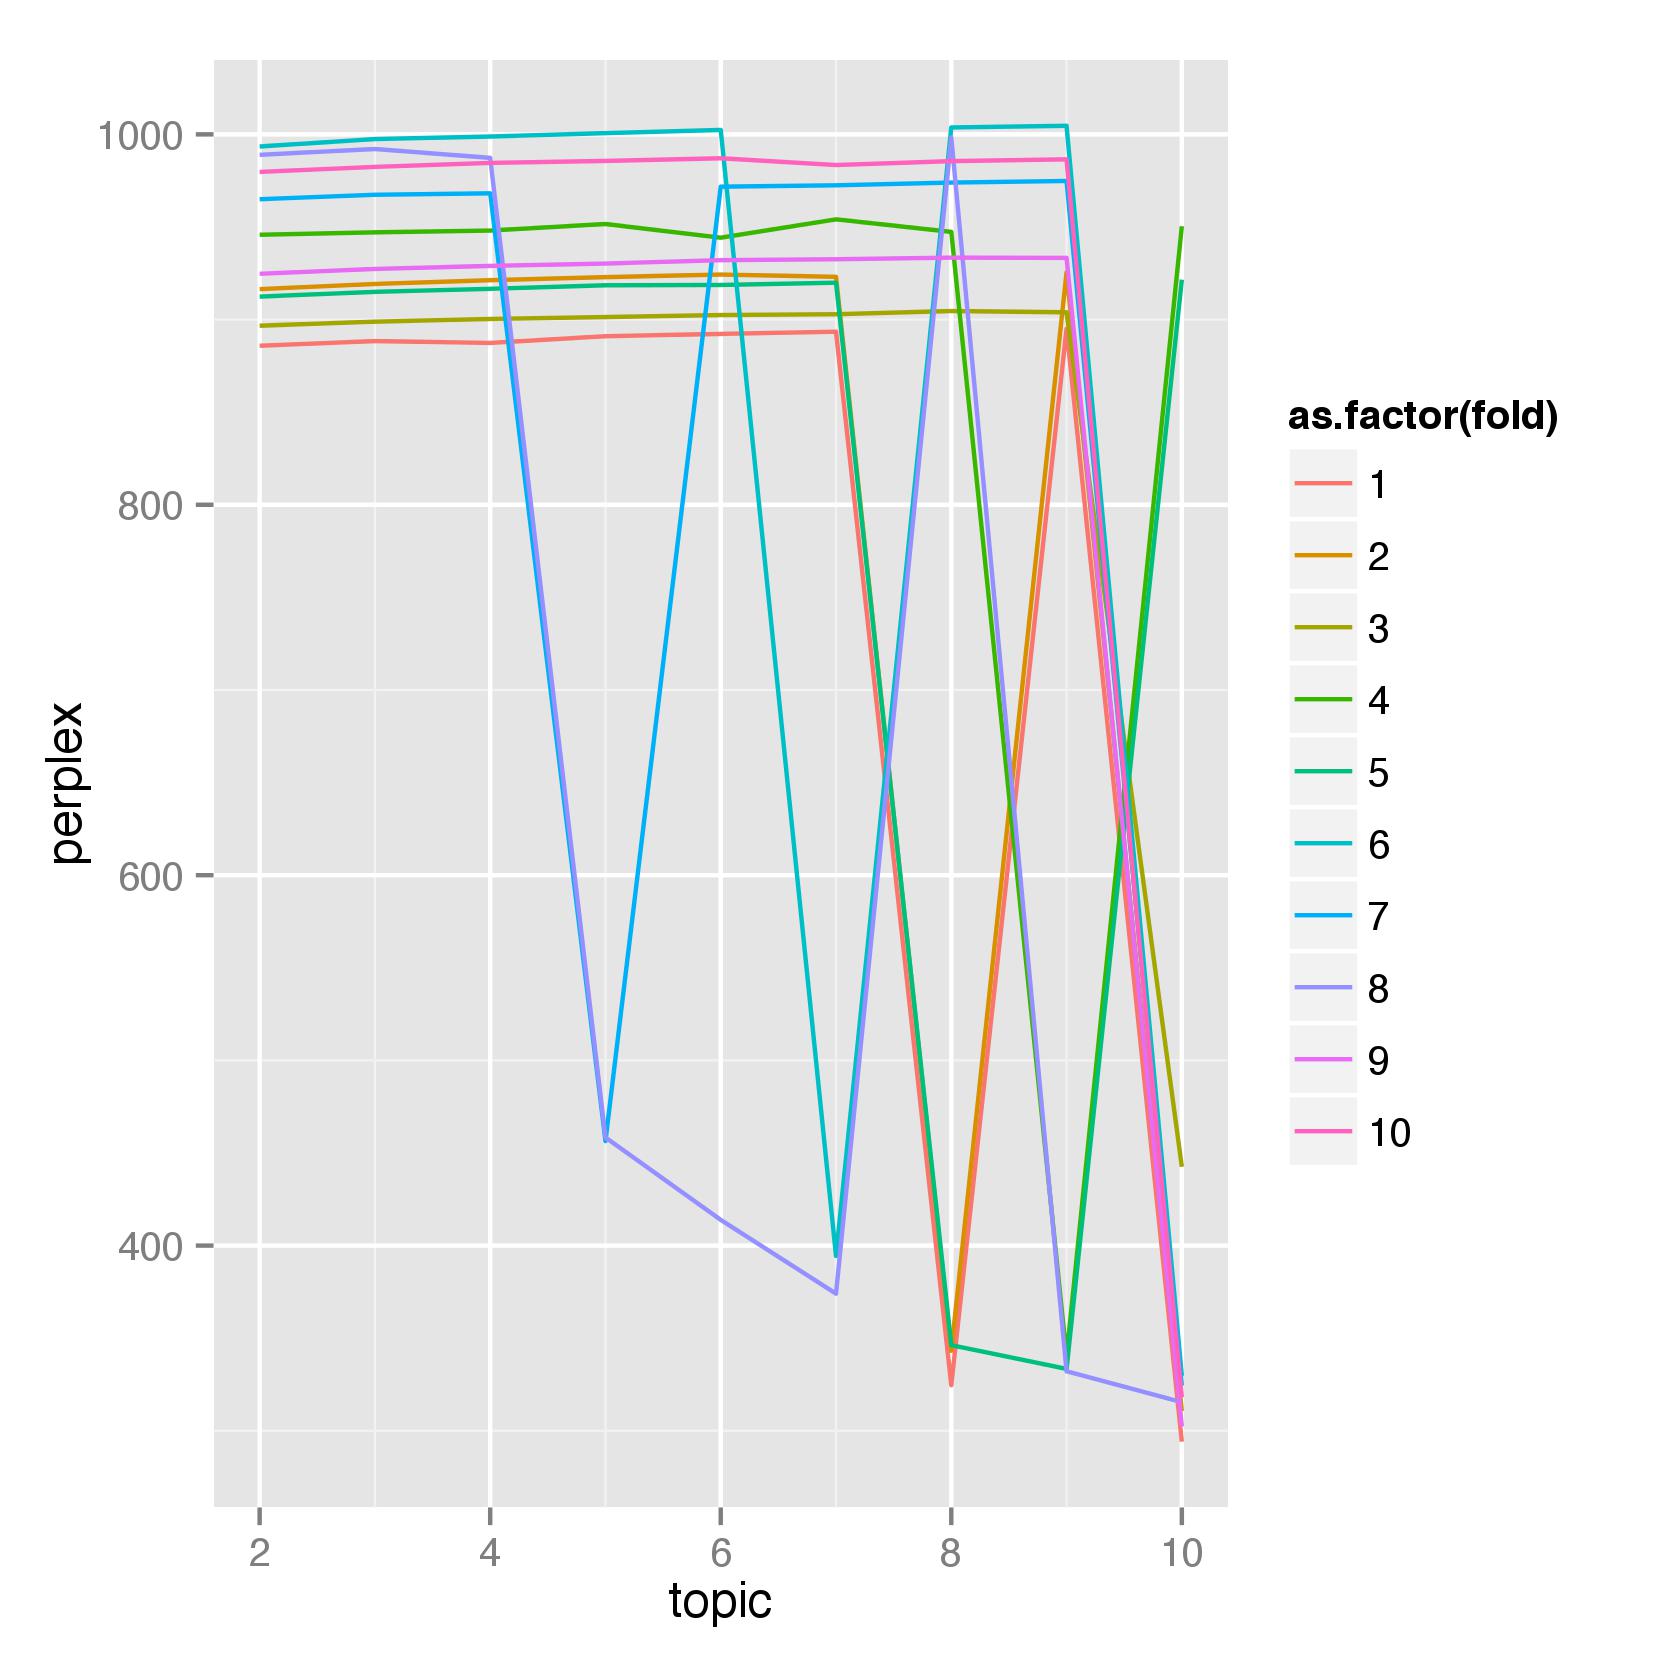
Perhaps a little hard to see, but 8 out of 10 cross-validation holdout sets picked 10 as the optimal value. Here are the most frequent terms used in the 10 topics identified by my model:
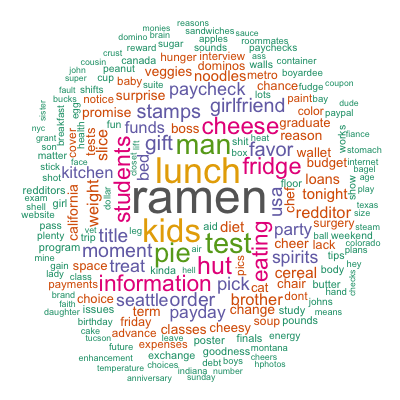
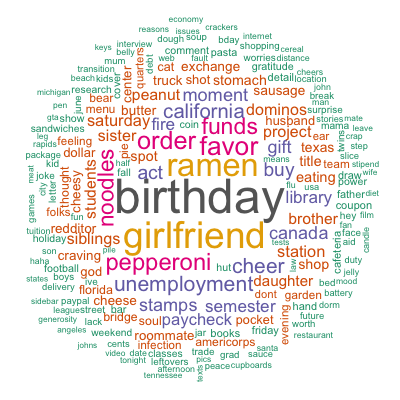
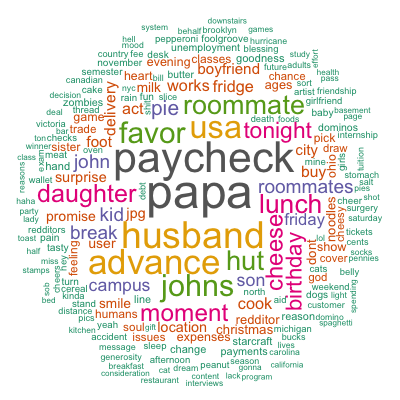
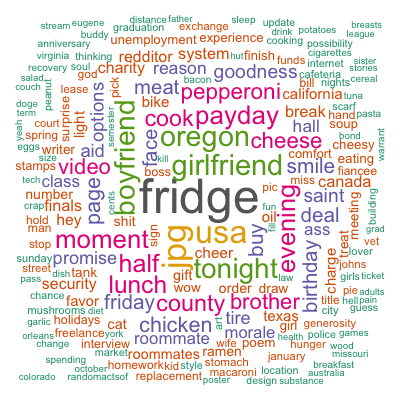
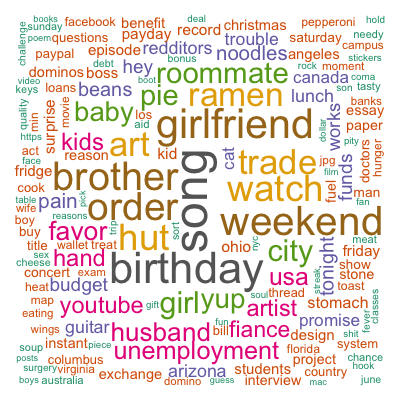
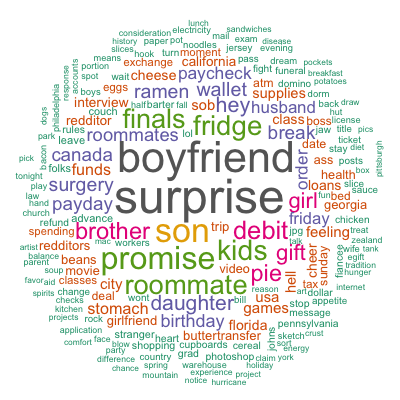
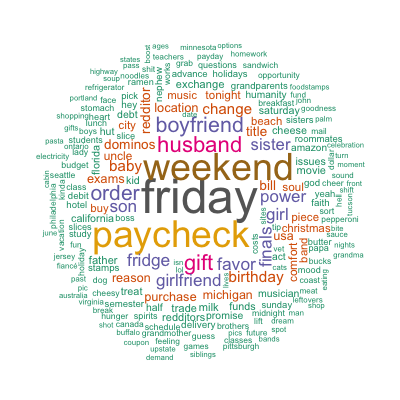
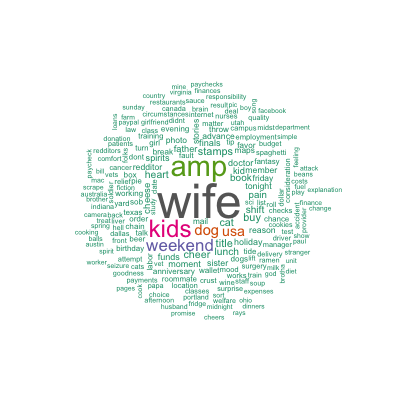
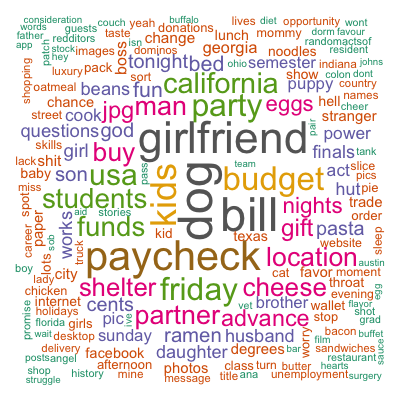
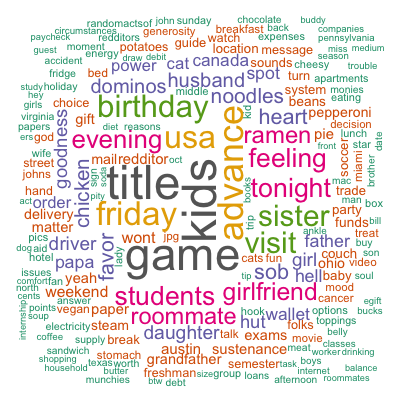
Although there are some patterns detected such as financial difficulties, family, parties, and so on, they are far less clear than those identified by the paper. Besides the different algorithms used, it may as well be that the authors performed more sophisticated cleaning and mining than I did. Out of curiosity, in addition to topic modeling, I also tried simple spherical k-means which, by default, restricts one document to only one cluster and hence forces the “topic” separation. As a result, my resulting 5 clusters (not shown here) are more different from each other and the patterns are closer to those found by the authors. Nevertheless, topic modeling was heaps of fun!
Create and explore variables
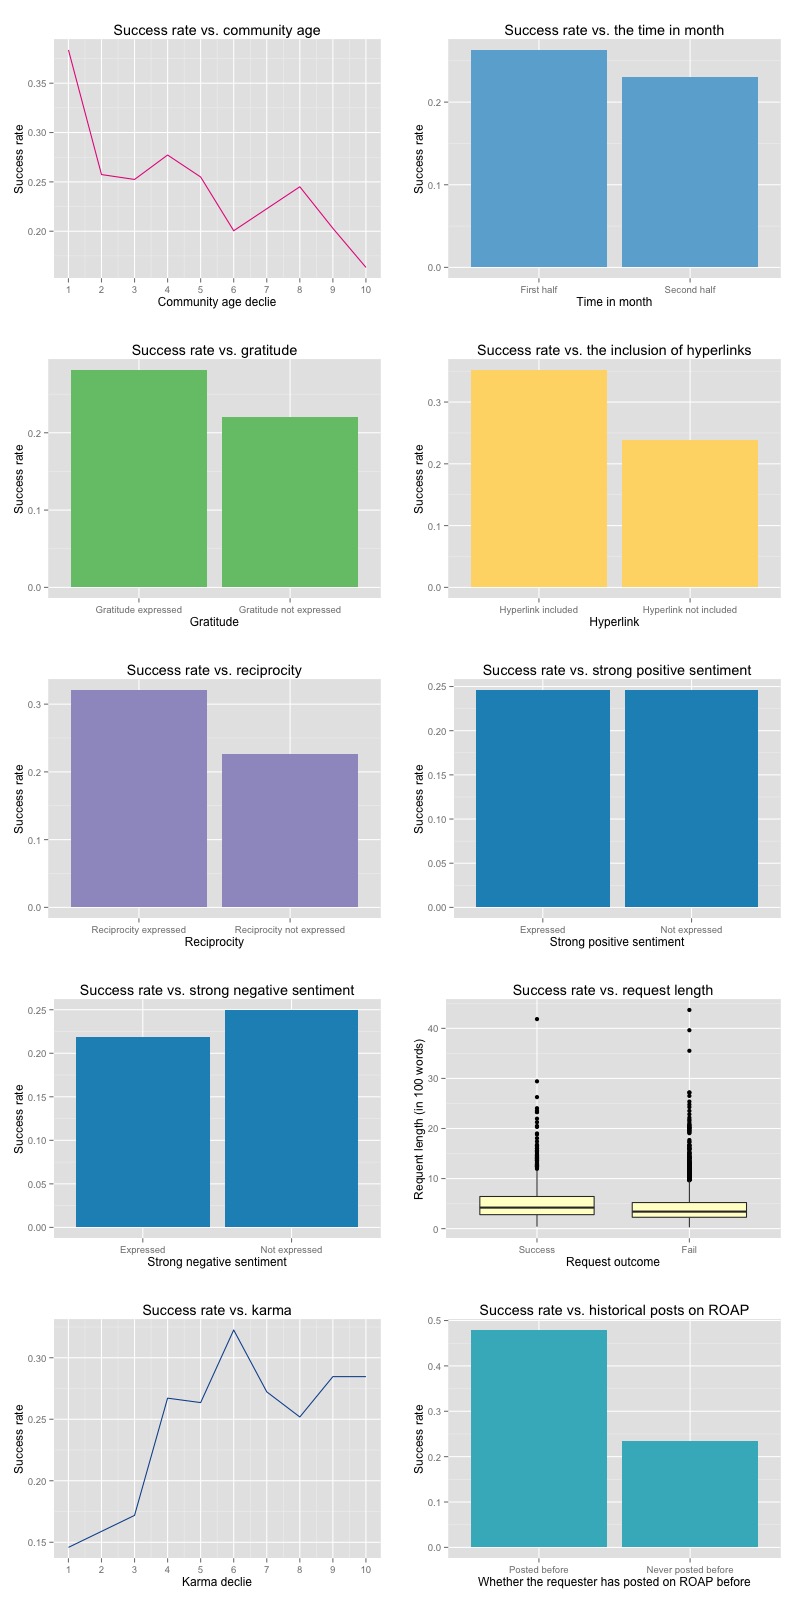
Following the authors’ methodology, I created the same set of variables that they used in their logistic regression. With regard to what these variables are, what they represent, and how they are constructed, please refer to the original paper. Here, I’ll just show their relationship with the success rate of the pizza request. First, let’s look at the 5 narrative buckets created using the key words suggested by the authors. They are created by matching the requests against those key words using regular expressions, counting the frequencies, dividing those by the total length of the request (including the title), and converted them into deciles. Here are the relationships between the deciles and the success rate for each bucket (the 0 deciles shown below represent the requests that do not have any key words for a particular bucket):
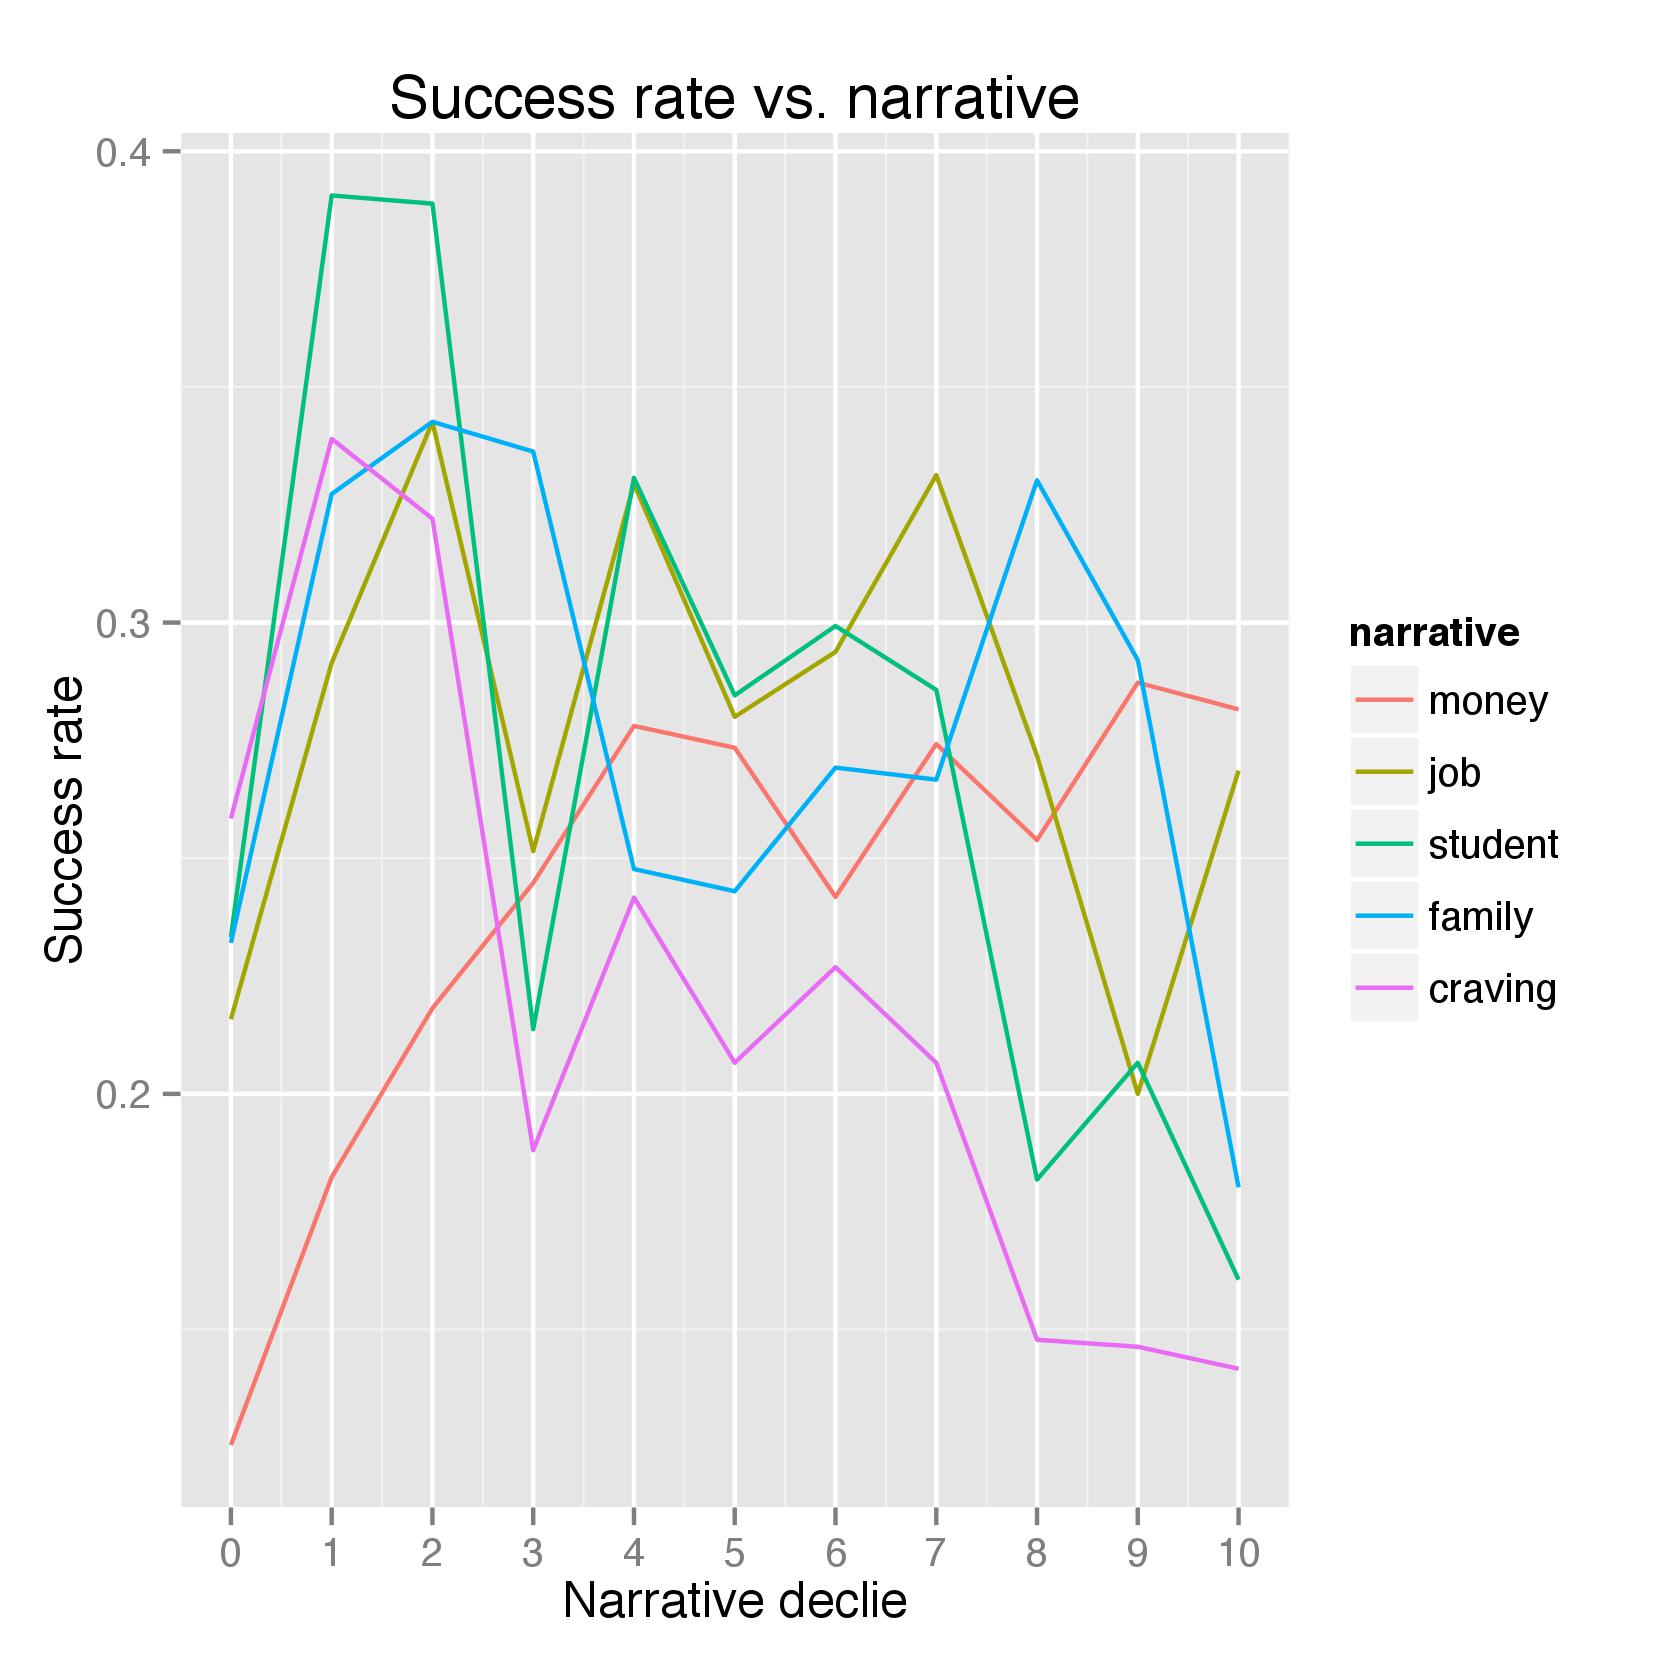
Interestingly, with the exception of money and craving, these narrative categories do not exhibit a clear linear relationship with the outcome. One of the reasons is that no other factors that may drive the outcome are controlled yet. At least for those that do show a clear trend, the relationship is in line with what the study has found (e.g., more mentions of money troubles lead to a greater chance of success whereas more mentions of craving lead to the opposite).
The other variables are more straightforward and their outcome is also more intuitive. Hence, I’ll just show their relationship with the success rate here. You can find the creation process in my code linked above.
Training models
Now that we have all the variables, we can finally train some models! The first model I tried is the same logistic regression used by the authors. Even without the paper, I think logistic regression, or linear regression in general, should always be the first thing to try because its inference power is very valuable in understanding the relationship between the explanatory variables and the outcome. Even if prediction is the sole purpose, I think it’s necessary, not to mention fun, to understand what the model can tell us about the hidden relationships. Here are the coefficients and their statistical significance I got from the logit model:
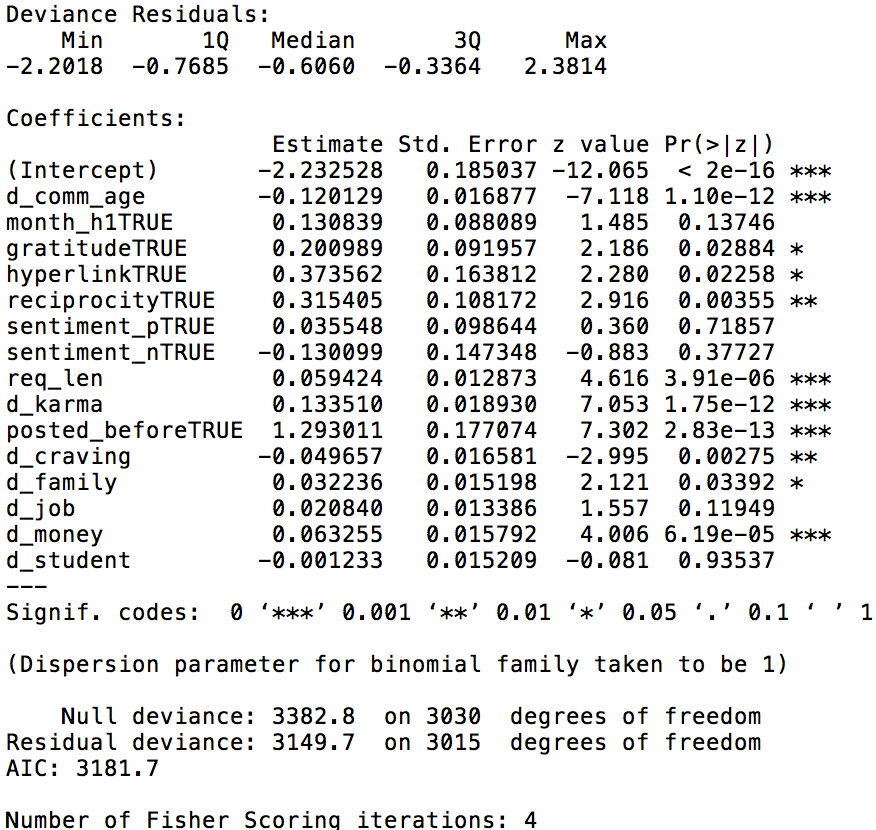
Comparing with the paper, I found my results are generally in line with the authors’. Specifically, we both found that gratitude, hyperlink (e.g., image), reciprocity, request length, karma, whether the requestor has posted on RAOP before, and mentions of family and money are all positively statistically significant while a request’s community age (i.e., the time passed since its post) and mentions of craving are both negatively statistically significant. Using a 10-fold cross-validation, I got an ROC of .664, which is close to their .669. Win!
In addition to logistic regression, I also tried random forests, gradient boost trees, and neural networks. Their performance, in terms of ROC, is shown in the parallel plot below (each line represents the results for a common cross-validation holdout set):
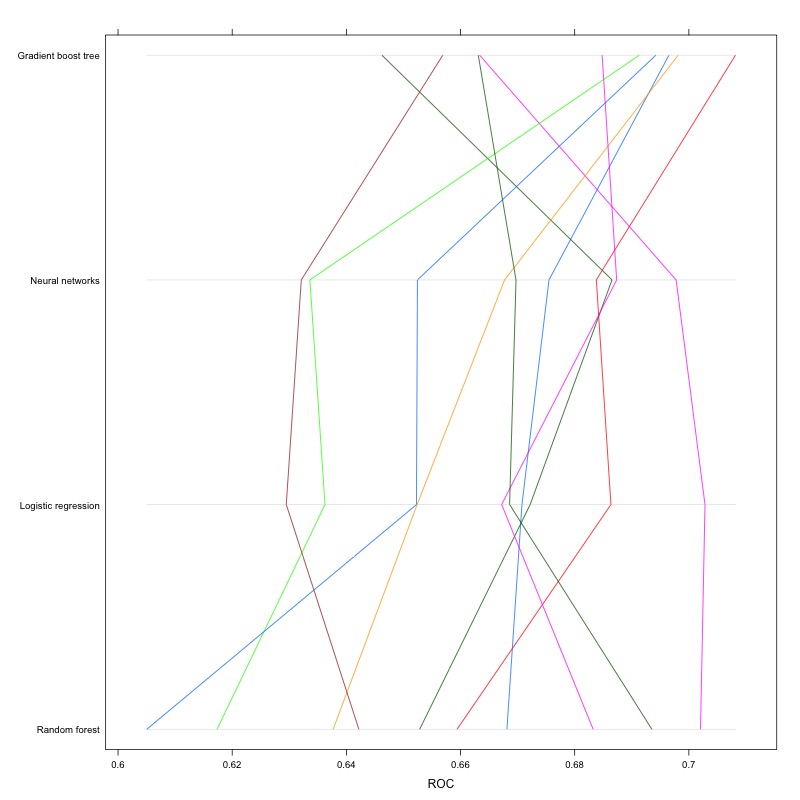
As shown above, the models yield comparable results with gradient boost trees performing slightly better than the other. Besides the performance itself, I think it’s also interesting to see how each model ranks the variable importance, so I made these plots as well:
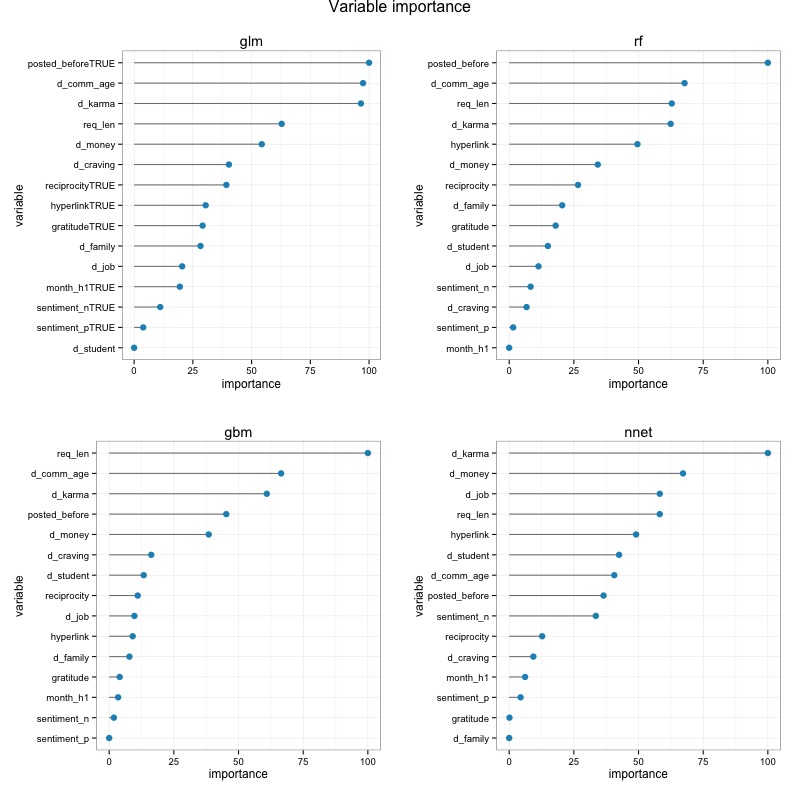
As it turned out, although the 4 models don’t agree on everything, they do all consider variables such as whether the requester has posted on the forum before, the post’s community age, karma, request length, and mentions of money as those that matter the most, which makes intuitive sense.
Predicting on test set
Finally, we are going to take these models on a test drive! Because of the similar performance, I combined them together by averaging the predicting result (i.e., the probability of success). The resulting ROC of .69, as calculated by Kaggle, is in line with the result I got by applying the same ensemble to the “test” set carved out from the training set using stratified sampling (by using the createDataPartition() function from the caret package). In fact, they are the same down to the 4th digit!
Conclusion
Similar to what the authors have found, a request (of anything?) is most likely to be granted if enough effort has been put into making them. This may include a detailed description of the situation, an explanation that will likely evoke empathy, and the requestor’s own reputation. Armed with this knowledge, I’m going to try my luck on the RAOP forum myself.