Leaflet is a popular javascript library for making interactive maps. Don’t know how to code in js? No problem, thanks to Ramnath Vaidyanathan, you can now use rCharts to do it in R! Now that we have R Shiny, it just seems a natural thing to combine the two together to make Shiny apps for interactive maps. If that doesn’t motivate you, take a look at these cool examples and roll up your sleeves and make one yourself (example1, example2)!
As for my first leaflet app, I decided to make a yelp-like app that takes the user’s current address as input and displays points of interests nearby such as restaurants and libraries per user’s choice. Instead of using yelp’s data directly, I opted to using Factual’s. To those who are not familiar with Factual, it’s a 3-year old company headquartered in LA (yeah!) that is specialized in aggregating location data. I think yelp, among other app makers, is actually one of their customers. If you are interested, you can request an API key from their website, which is free of charge and can be used to query up to 10,000 times a day (each individual query, though, is capped at 50 results). You can find all the place categories that are covered here and check out their sample data by playing around with its API.
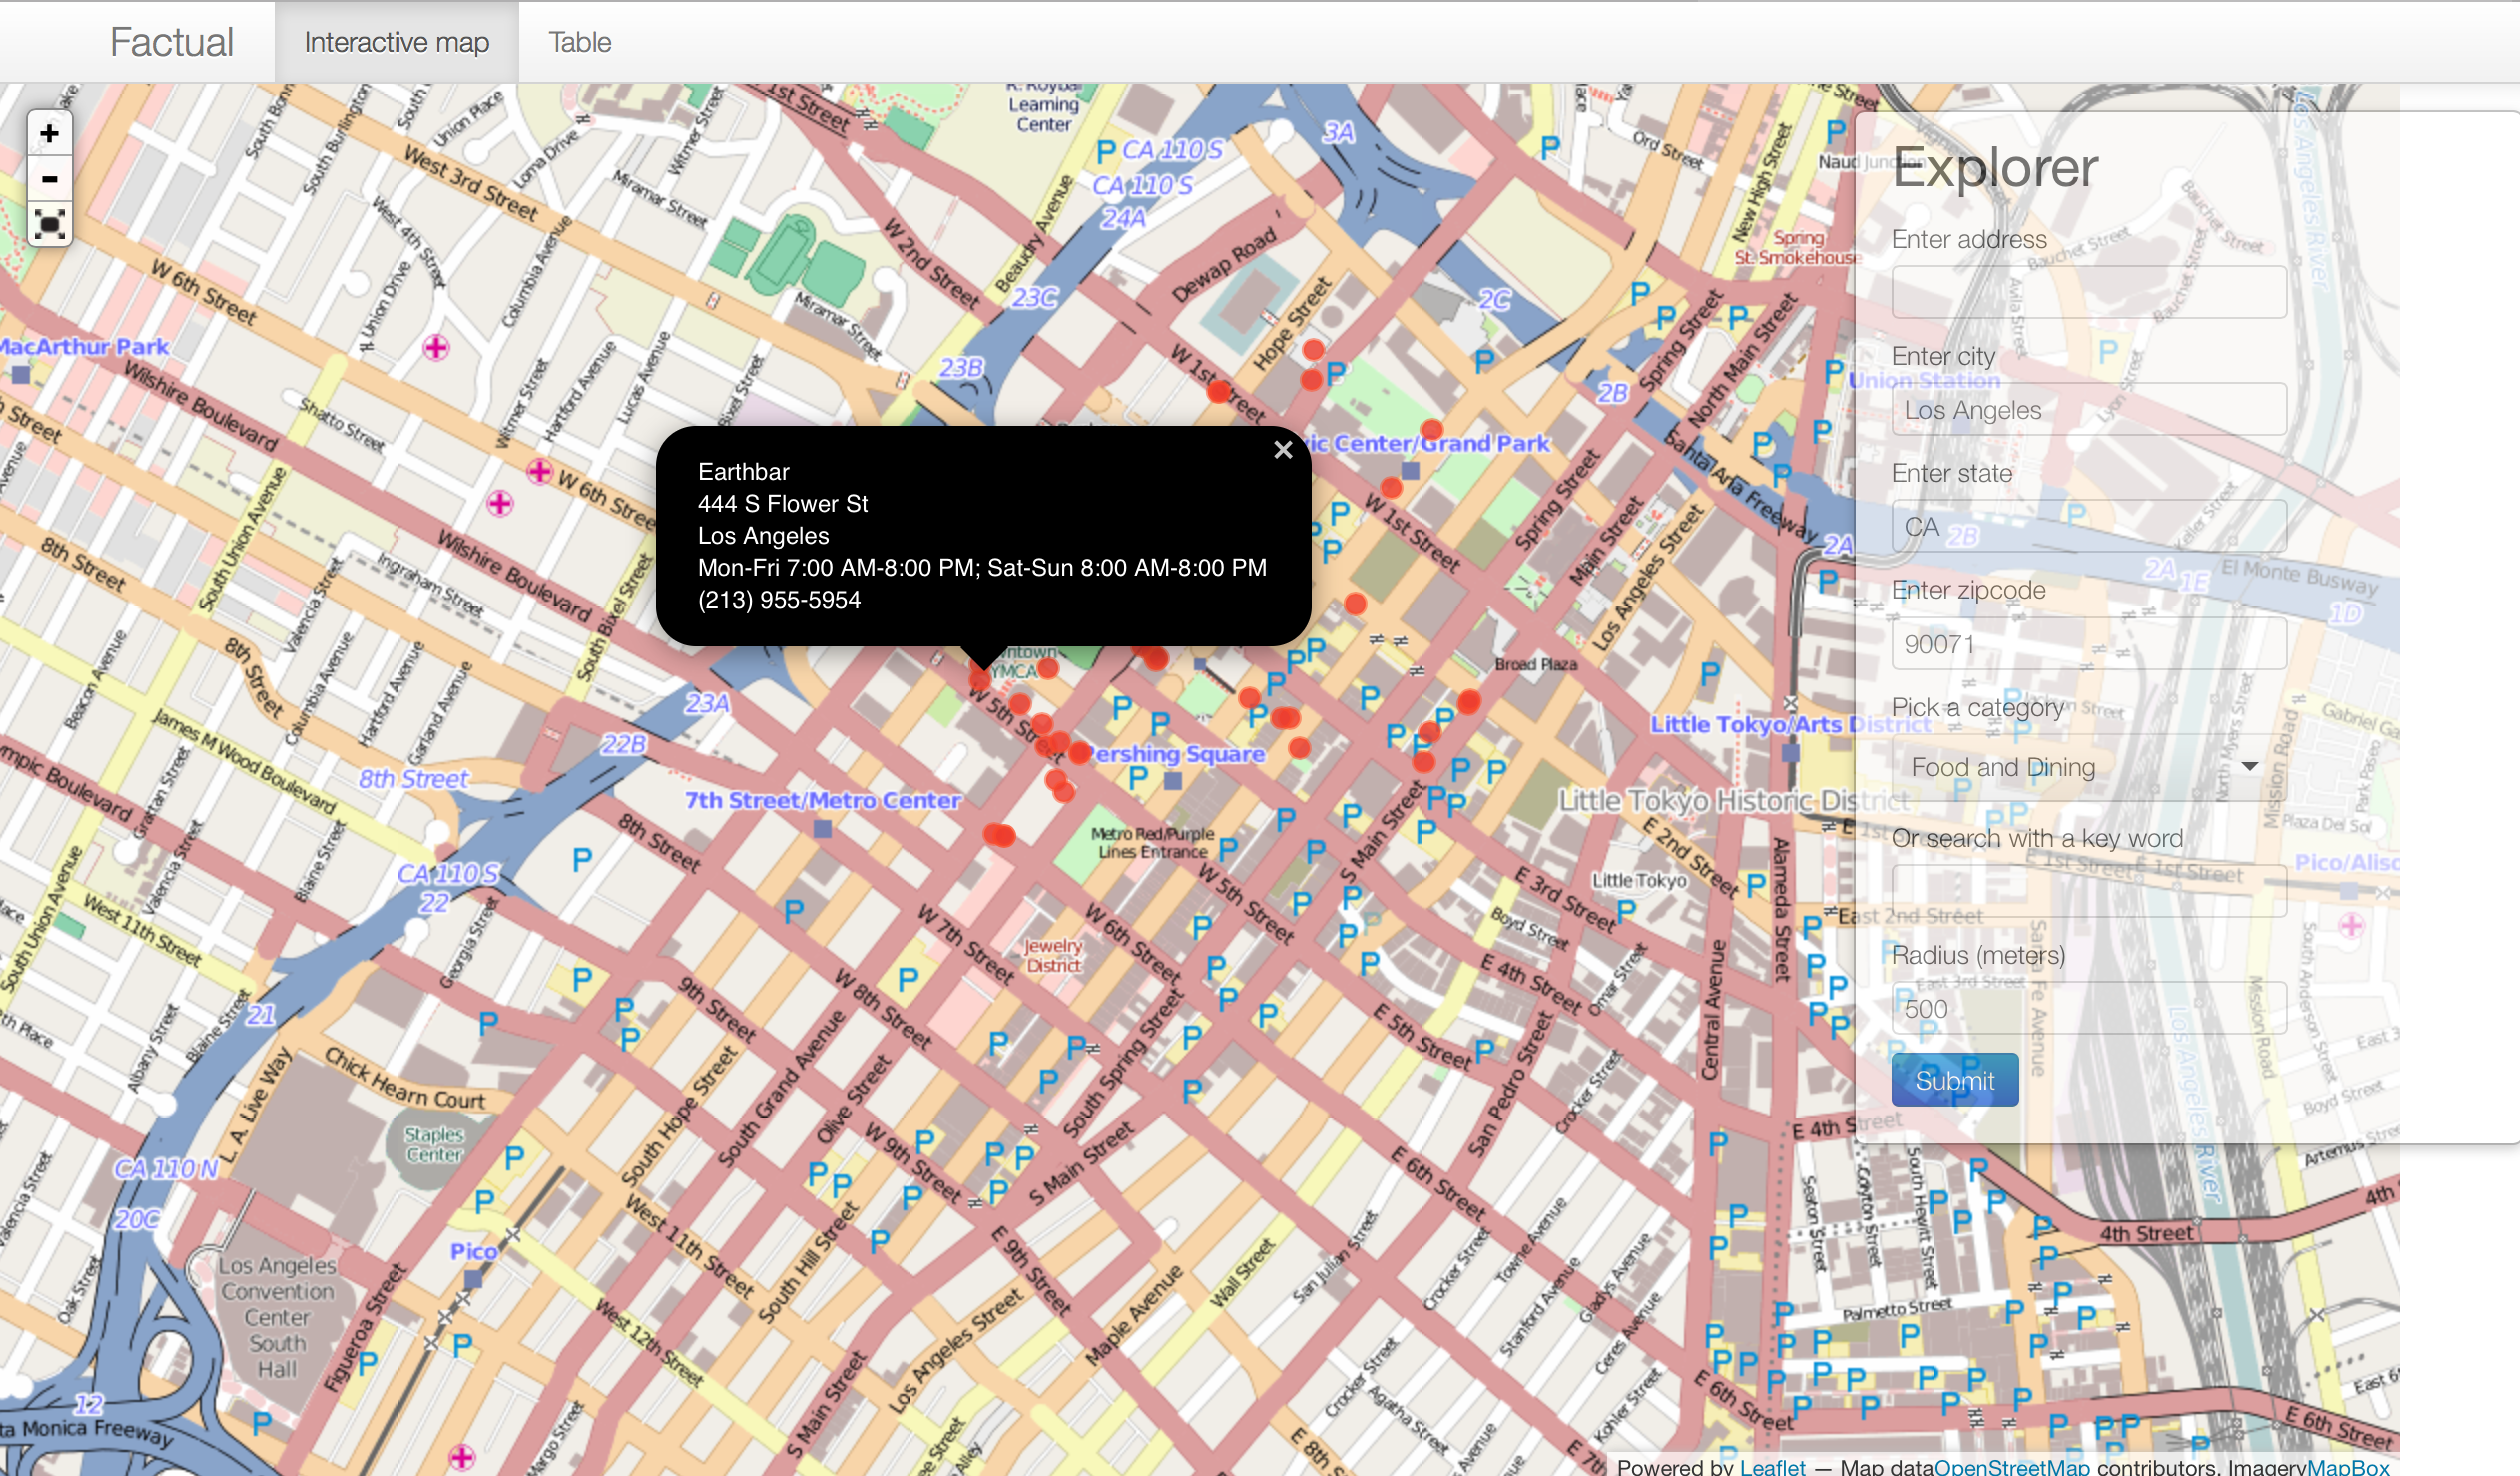
And here is my app :-)
http://runzemc.shinyapps.io/factual/
Data query using Factual API
On Factual’s developer website, you can find all the API drivers it currently offers. Unfortunately, R is not one of them. I spent some time trying to figure out how to query data in R “manually” using the httr or similar packages, but couldn’t work out the 2-legged oauth part (there is indeed an R package called factualR but it looks like it’s using an older version of the API). Factual does provide a simple unauthenticated method to query its data, but the rate limit is much lower. Luckily, rPython saved the day :-)
Without sounding too fanboy-ish, I believe rPython is the best thing that happened to the humanity. It lets you easily execute python commands, call python functions and scripts solely within R! One caveat is that it can only be installed on unix-based OS at this stage, but we’ll let it fly. Below is my code for performing the oauth and querying the data using Factual’s python module:
#add factual and oauth modules to a folder under the app directory (to be bundled together when deployed)
python.exec('import sys')
python.exec("sys.path.extend(['package'])")
#perform oauth
python.exec('from factual import Factual')
python.exec("factual = Factual('<api key>', '<api secret>')")
#function to resolve address
python.exec("def resolve(address, locality, region, postcode):
               return factual.resolve('places', {'address':address,'locality':locality,'region':region,'postcode':postcode}).data()")
#function to filter based on category, latitude, and longitude
python.exec("places = factual.table('places')")
python.exec('from factual.utils import circle')
python.exec("def filter(category, lat, lon, radius):
               return places.filters({'category_ids':{'$includes':category}}).geo(circle(lat, lon, radius)).limit(50).data()")
#function to filter based on keyword, latitude, and longitude
python.exec("def search(kw, lat, lon, radius):
               return places.search(kw).geo(circle(lat, lon, radius)).limit(50).data()")
These three python functions (i.e., resolving address, searching based on category, and based on keywords), which are later called in the program using python.call(), are all the core queries I implemented, although, to resolve address, I also relied on google maps API which I found to be very robust to missing information in user-entered location:
#if not found, try to use google maps to resolve
if (nrow(df_resolve) == 0) {
 full_addr = paste(address, city, state, zipcode)
 gg_res = geocode(full_addr)
 df_resolve = data.frame(gg_res$lat, gg_res$lon)
}
Creating a leaflet map
Now that we have the data, we can finally show them on a pretty leaflet map. When doing this, I found Ramnath’s bike-sharing app / tutorial most helpful. Honestly, I pretty much just stole his code and spent the majority of the time trying to decide on the best color combination for the circles on the map (can you tell the border of the circles is of a slightly lighter color than the filling?). Therefore, I’ll defer to him, the author of rCharts, to demonstrate the use of the package. Although I’ll add that he is very helpful and responsive to questions and issues, and is very active in the R community.
The rest of the steps, including parsing the retrieved data and putting together all the pieces and wrapping them in Shiny, are all pretty standard and can be found in my github. In addition to creating the map, I also showed the data in a table on another tab using Shiny’s built-in renderDataTable() function. You are welcome.
Isn’t that fun?