R Shiny is an R package that is designed to easily create and deploy pretty web apps all in the nifty RStudio. Right now, it may not be able to make sophisticated or aesthetically pleasing web apps like d3.js, but, by leveraging R’s powerhouse analytical capability, I believe it has great potentials. One possible application I can think of is education. Take this k-means app for instance, I wish I had a chance to play with this interactive app when learning about the algorithm myself.
This weekend, I decided to finally try my hands on it and this is the result!
https://runzemc.shinyapps.io/shiny/
Background and Methodology
The subject I wanted to analyze is the most played artists and their songs on KCRW (initially inspired by this Shiny app created by Andrew Landgraf). KCRW is an NPR radio station in Santa Monica and, in addition to all the independent news programs, it has a wonderful music taste, especially late at night when it starts blasting EDM (it certainly makes driving home from work at 3 am much more enjoyable :-)). It has its superstar hosts (e.g., Jason Bentley) and has lots of artists drop by and give live performance. It’s also particularly good at discovering the next indie hits and supports indie artists greatly. For example, I discovered Lorde from it and got to tell everyone I liked her before she was cool.
KCRW has two music channels: KCRW on air and KCRW eclectic 24, the latter of which is for internet streaming and plays music all day long. For this analysis, I chose the former because the genres of the music played on air are more varied given the different hosts’ different tastes and are picked per different time of a day (e.g., late night EDM!), which, as shown below, is an important part of my analysis. Also there seems to be less repetition on air.
The first step is to crawl the playlists from KCRW. Fortunately, the good folks who designed the website made this step very easy. Here is a link to its playlist and you can see the table is very clean and perfect for R’s htmlTreeParse and readHTMLTable functions. I pulled all the playlists from 1/1/13 to 6/17/14 by looping through all the dates in between and changing the URL with them, but, looking back, an easier way would just be first specifying the whole date range and then modifying the page start position each time, which is equivalent to keeping pressing the “next 50 results” button. Anyway, the resulting data has about 60,000 records and contains information on the play date and time as well as the names of the songs, the artists, and the albums. After cleaning the data, I calculated the monthly played times for each artist and for each song and was ready for some “shiny” visualization.
By the way, I learned Shiny mostly from this awesome tutorial put together by RStudio. If you have plenty of experience with R already, it shouldn’t take more than half a day. Besides, you can flesh out your own app right away as you learn the new features.
What the Data Says
After getting the data ready, the first thing I was eager to find out is who the top artists are. Below is the output from my app showing the top 20 artists covering the entire period:

The legend is ordered by the ranking (in the descending order) and goes from top to bottom and then left to right. To be honest, I was a little surprised that Beck took the crown jewel. In fact, looking at the data, I found that he was played consistently throughout the whole time. Nevertheless, some of my favorite artists (e.g., Phoenix, Disclosure, Bonobo, Vampire Weekend, and James Blake) did make it to the top 20.
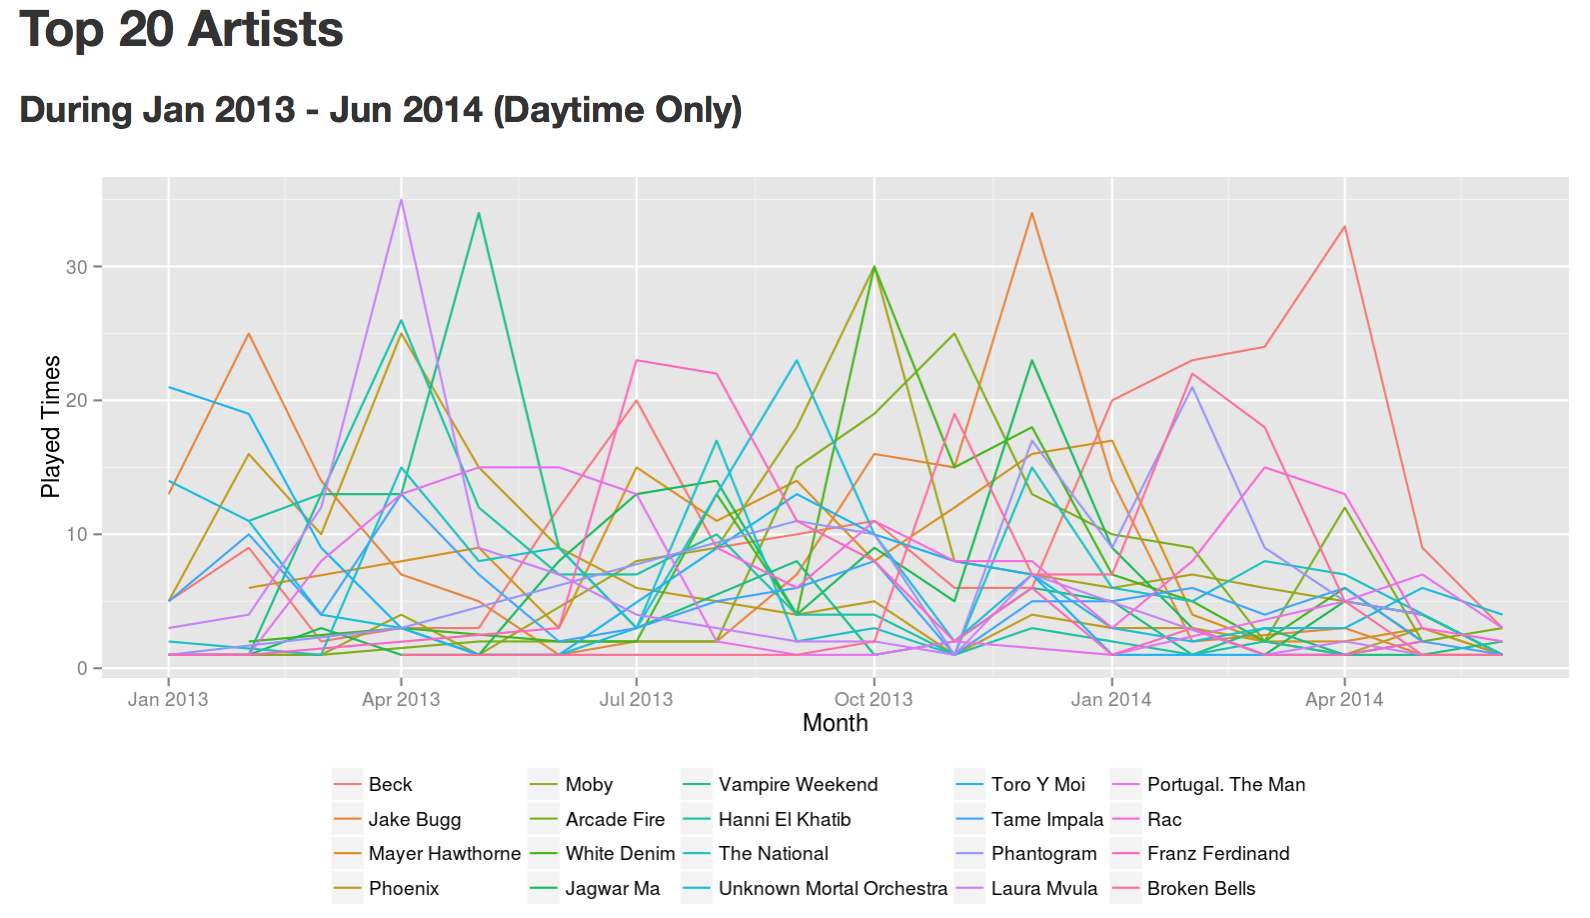
Above we looked at the all-day playlists, but is there a difference between the music played during the daytime and night? To answer this question, I split the data into 2 parts based on the timestamp, i.e., one for the daytime (6 am - 6 pm) and one for the night (6 pm - 6 am). Because afternoon and early evening are usually taken by news at KCRW, we don’t have any problem for the cutoff time (there is rarely any music played around either 6 am or 6 pm). First, let’s look at the daytime:

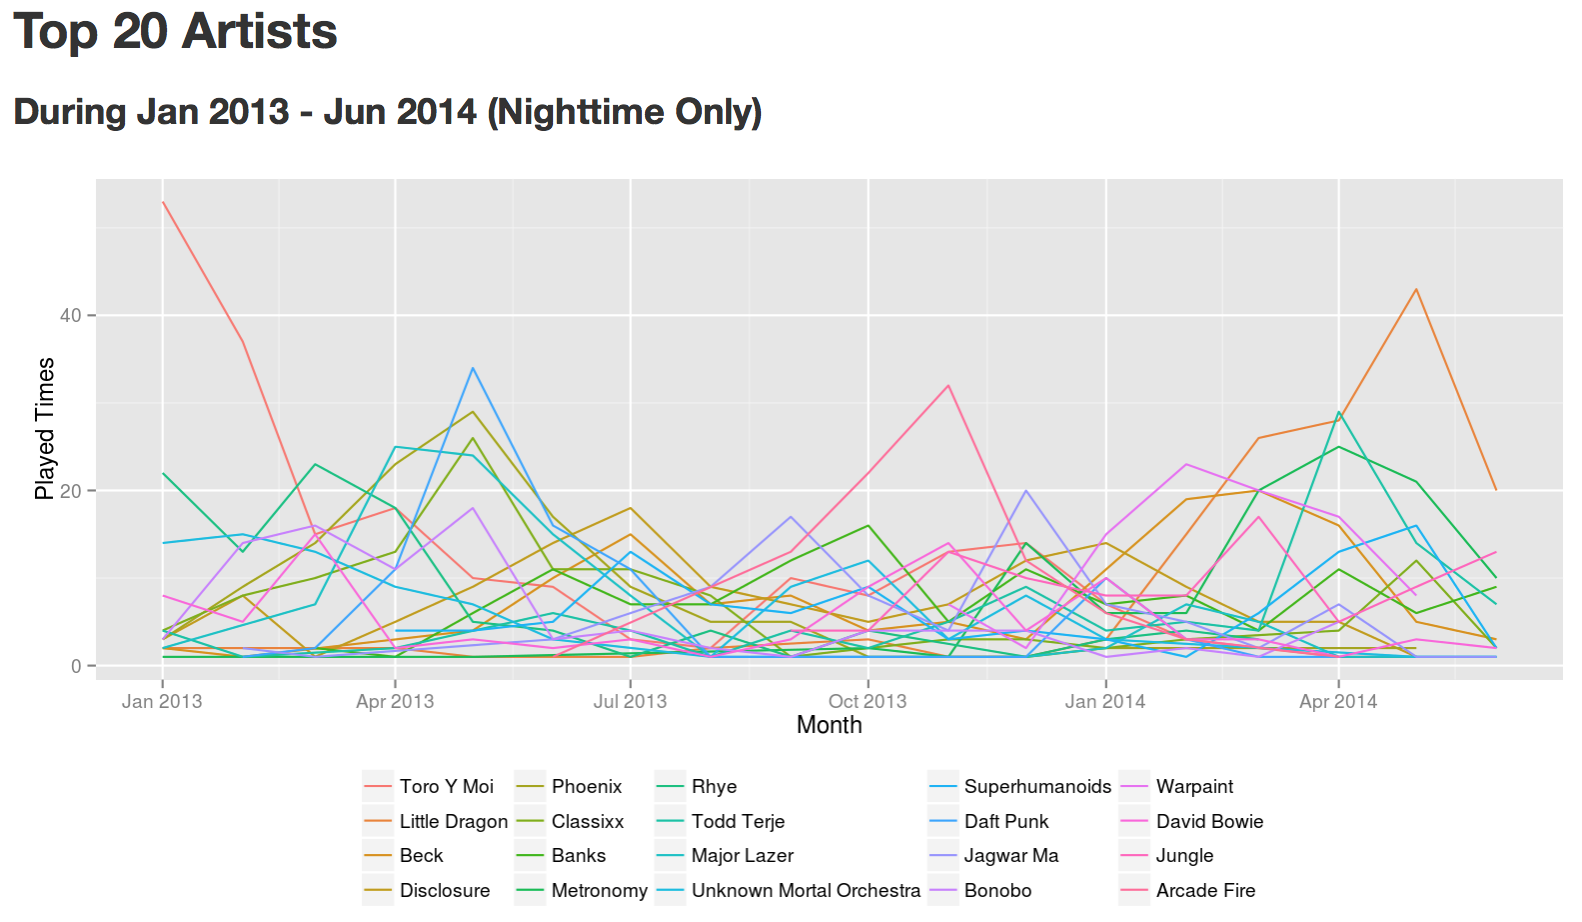
And then during the night:

Despite the overlaps, we do see a lot of variation. For example, Disclosure is much more heavily played at night, which makes sense (really, I can’t imagine anyone turning down this at night). Similarly, Daft Punk is a nighttime favorite as well. As for the daytime, indie pop/rock bands such as Vampire Weekend and Phantogram are apparently more popular.
What about individual artists? What songs of them were getting played exactly? By selecting “Artist-Specific” in the chart option, we can enter the name of our favorite artist and find out ourselves.
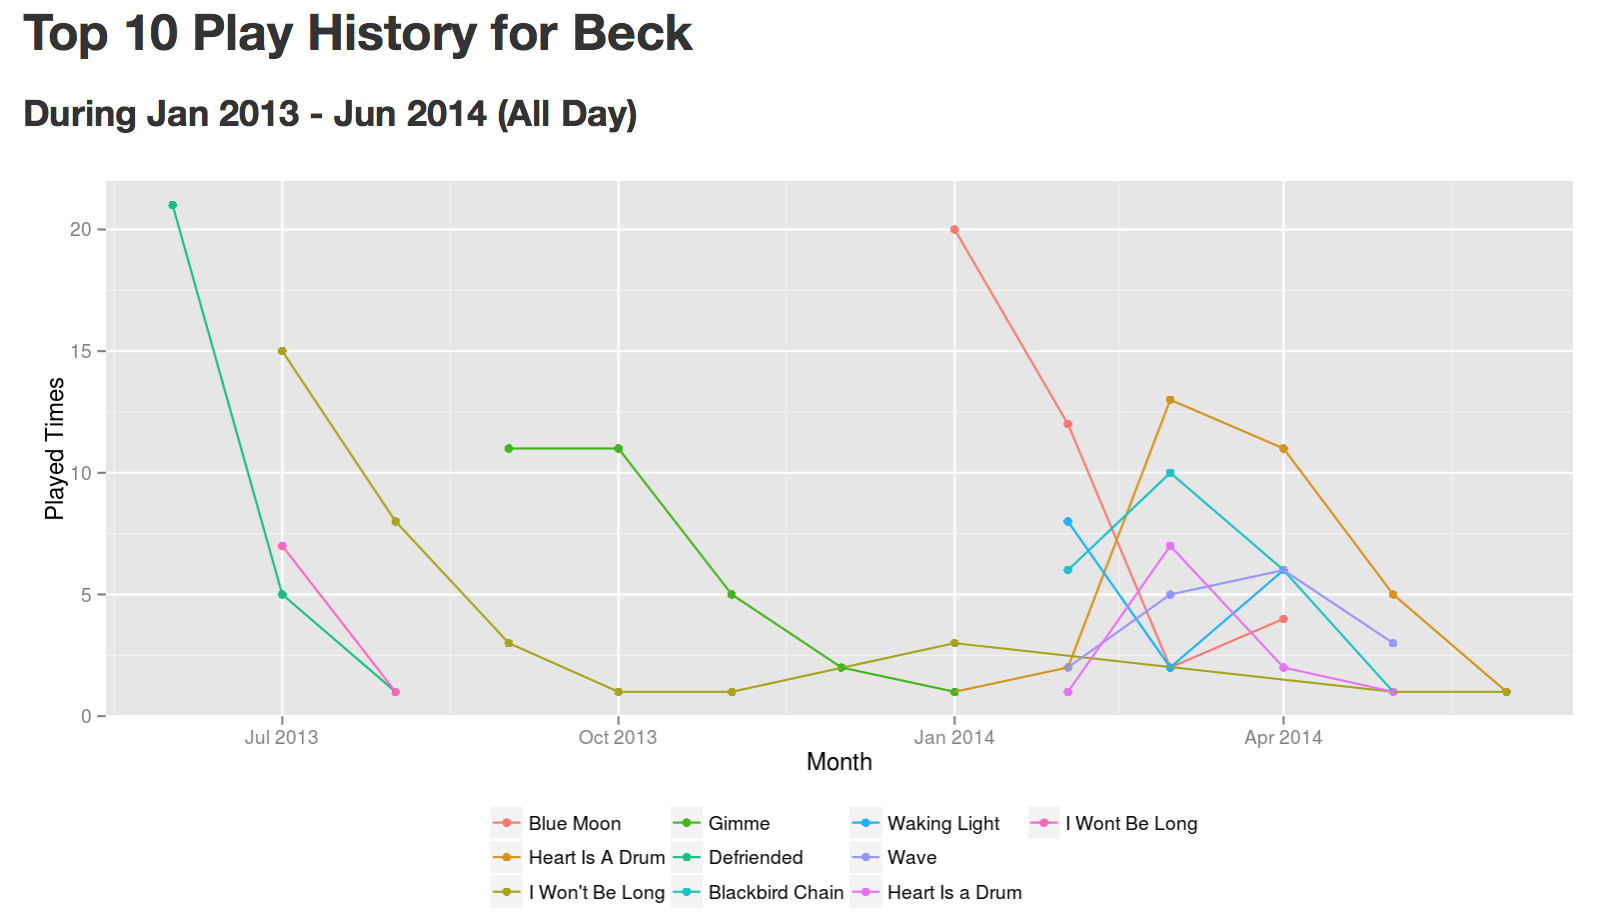
Starting with Beck (note only the top 10 songs of his are shown):

Looking at this chart, I can finally see why he was consistently ranked the highest: whenever one of his songs fell out of favor, almost immediately another song would catch up. I should really start to listen to him more.
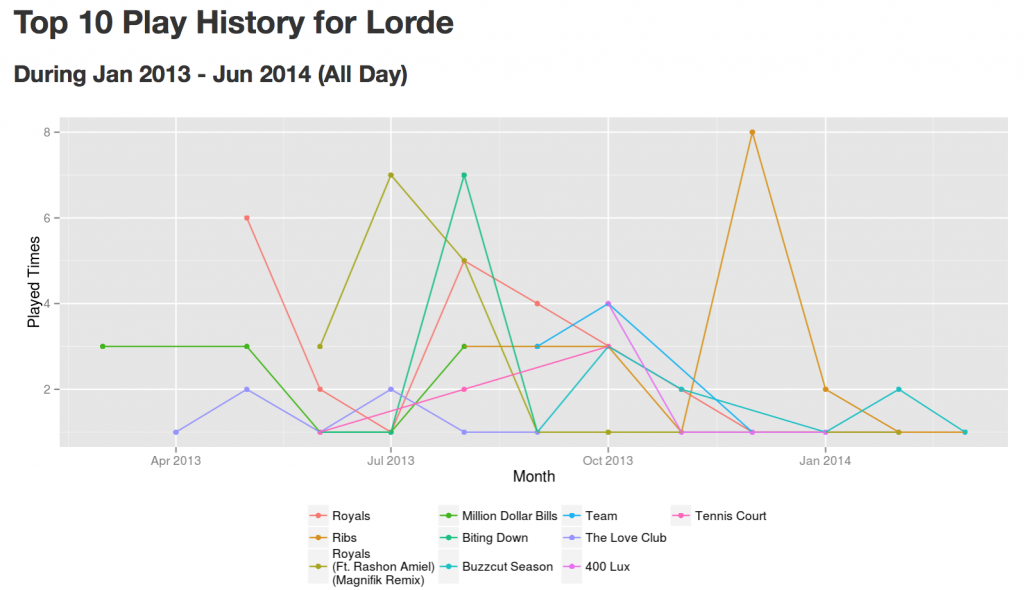
Let’s look at another artist: Lorde. Although not among the top 20, she was ranked 26.

Interestingly, after Royals had an impressive debut in May 2013, it quickly dropped but rebounded again in August. I wonder if that was around the time when she was recognized by the mass, or maybe it was with the help of the Magnifik Remix that peaked in July (which, in my humble opinion, is pretty awful, especially given the original was so good). I’m a little sad that 400 Lux and Tennis Court did not get as many plays though.
Conclusion and Future Work
KCRW has an awesome music taste and R Shiny is an intuitive and easy way to get your feet wet on web app development but, backing by the powerful R, its capability goes way beyond making pretty charts. My next goal is to come up with a project that will truly take advantage of its analytical power. One thing I can think of now is to make an interactive machine learning tool that allows model selection and parameter tuning (I read somewhere Microsoft is actually working on such a program called ML Studio itself).